2011 Atlantic hurricane season
| Season summary map | |
| First storm formed | June 28, 2011 |
|---|---|
| Last storm dissipated | November 12, 2011 |
| Strongest storm | Ophelia – 940 mbar (hPa) (27.77 inHg), 140 mph (220 km/h) |
| Total depressions | 20 |
| Total storms | 19 |
| Hurricanes | 7 |
| Major hurricanes (Cat. 3+) | 3 |
| Total fatalities | 100 direct, 14 indirect |
| Total damage | > $12.2 billion (2011 USD) |
| Atlantic hurricane seasons 2009, 2010, 2011, 2012, Post-2012 |
|
| Related article | |
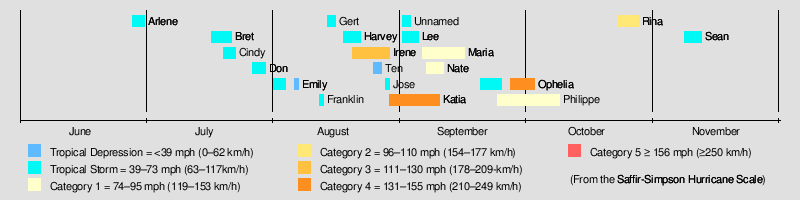
The 2011 Atlantic hurricane season produced 20 tropical cyclones, 19 tropical storms, 7 hurricanes, and 3 major hurricanes. It featured an above average number of tropical storms with a near normal number of major hurricanes. The season officially started on June 1 and ended on November 30, dates which conventionally delimit the period during which most tropical cyclones form in the Atlantic basin.[1] The first tropical cyclone, Tropical Storm Arlene, developed on June 28, while the season's last storm, Tropical Storm Sean, dissipated on November 12. The most intense storm, Ophelia, was a Cape Verde-type hurricane that became a Category 4 hurricane on the Saffir-Simpson hurricane scale at an unusually high latitude. The season featured a record sequence of weak tropical storms, beginning with Tropical Storm Arlene, and ending with Harvey.[2] The season's first hurricane, Irene, was a powerful Category 3 hurricane that made landfall in North Carolina as a Category 1, causing significant damage and record flooding to the Northeast United States. The season tied 2010, 1995, and 1887 for the third highest number of tropical storms.
Pre-season forecasts released by Colorado State University (CSU) called for 17 tropical storms and 9 hurricanes, of which 5 were expected to attain major hurricane status. The National Oceanic and Atmospheric Administration (NOAA) later issued its initial forecast, which predicted 12 to 18 named storms, 6 to 10 hurricanes, and 3 to six major hurricanes. The number of tropical storms during the season was slightly above these numbers, while the number of major hurricanes were near normal or slightly below normal.
Several storms made landfall or directly affected land. Tropical Storms Arlene, Bret, Cindy, Don, Emily, Franklin, Gert, Harvey, and Jose only brought moderate rainfall totals and minor damage to part of Mexico, Caribbean Islands, the Bahamas, and Bermuda throughout the season. Meanwhile, the only storm to strike the USA coastline during the season, Irene, caused significant damage along the United States East Coast, killing many people. Tropical Storm Lee contributed to record rainfall in the Northeast, an area already severely affected by rainfall from Irene. The combined storms killed 114 people and caused greater than $12.2 billion (2011 USD) in damage.
Seasonal forecasts
| Source | Date | Named storms |
Hurricanes | Major hurricanes |
|
| Average (1950–2000)[3] | 9.6 | 5.9 | 2.3 | ||
| Record high activity | 28 | 15 | 8 | ||
| Record low activity | 4 | 2 | 0† | ||
| ––––––––––––––––––––––––––––––––––––––––––––––––––––––– | |||||
| TSR | December 6, 2010[4] | 11–20 | 5–11 | 2–6 | |
| CSU | December 8, 2010[3] | 17 | 9 | 5 | |
| TSR | April 4, 2011[5] | 10–18 | 5–10 | 2–5 | |
| CSU | April 6, 2011[6] | 16 | 9 | 5 | |
| NOAA | May 19, 2011[7] | 12–18 | 6–10 | 3–6 | |
| TSR | May 24, 2011[8] | 10–18 | 5–10 | 2–5 | |
| UKMO | May 26, 2011[9] | 13 | N/A | N/A | |
| CSU | June 1, 2011[10] | 16 | 9 | 5 | |
| FSU COAPS | June 1, 2011[11] | 17 | 9 | N/A | |
| WSI | July 26, 2011[12] | 15 | 8 | 4 | |
| CSU | August 3, 2011 | 16 | 9 | 5 | |
| NOAA[13] | August 4, 2011 | 14–19 | 7–10 | 3–5 | |
| WSI | September 21, 2011 | 21 | 7 | 4 | |
| ––––––––––––––––––––––––––––––––––––––––––––––––––––––– | |||||
| 19 | 7 | 3 | |||
| *† Most recent of several such occurrences. (See all) | |||||
Forecasts of hurricane activity are issued before each hurricane season by noted hurricane experts Philip J. Klotzbach, William M. Gray, and their associates at Colorado State University; and separately by NOAA forecasters.
Klotzbach's team (formerly led by Gray) defined the average number of storms per season (1950 to 2000) as 9.6 tropical storms, 5.9 hurricanes, 2.3 major hurricanes (storms reaching at least Category 3 strength in the Saffir-Simpson Hurricane Scale) and ACE Index 96.1.[14] NOAA defines a season as above-normal, near-normal or below-normal by a combination of the number of named storms, the number reaching hurricane strength, the number reaching major hurricane strength and ACE Index.[15]
Pre-season forecasts
On December 8, 2010, Klotzbach's CSU team issued its first extended-range forecast for the 2011 season, predicting well above-average activity with 17 named storms, nine hurricanes, and five major hurricanes. In addition, the team expected an accumulated cyclone energy (ACE) value of approximately 165, citing that El Niño conditions were unlikely to develop by the start of the season. Lastly, the team noted a higher chance for storms to make landfall in the United States than in 2010.[3] In addition, Tropical Storm Risk (TSR), a public consortium that comprises experts on insurance, risk management and seasonal climate forecasting at University College London, issued an extended-range forecast a few days prior to that of CSU, with similar estimates for the year. In its report, TSR noted that tropical cyclone activity could be about 40% above the 1950–2010 average, with 15.6 (±4.3) tropical storms, 8.4 (±3.0) hurricanes, and 4.0 (±1.7) major hurricanes anticipated, and a cumulative ACE index of 141 (±58).[4] On April 6, 2011, the CSU team slightly revised their December forecast, predicting 16 named storms, nine hurricanes, and five major hurricanes.[6]
On May 19, 2011, the Climate Prediction Center issued NOAA's outlook for the Atlantic hurricane season. The CPC expected that 12–18 named storms, 6–10 hurricanes, and 3–6 major hurricanes would form in the Atlantic during 2011. The center cited above-normal sea surface temperatures, a weakening La Niña, and the effect of the warm regime of the Atlantic multidecadal oscillation as the basis behind their forecast, adding that seasonal climate models hint that "activity comparable to some of the active seasons since 1995" could occur.[7] On May 26, the UK Met Office (UKMO) issued a forecast of a slightly above-average season. They predicted 13 tropical storms with a 70% chance that the number would be between 10 and 17. However, they do not issue forecasts on the number of hurricanes and major hurricanes. They also predicted an ACE Index of 151 with a 70% chance that the index would be in the range 89 to 212.[9]
Mid-season forecasts
On June 1, CSU released their mid-season predictions, with numbers unchanged from those published in April.[10] Concurrently, the Florida State University Center for Ocean-Atmospheric Prediction Studies (FSU COAPS) issued its third annual Atlantic hurricane season forecast, predicting seventeen named storms, nine hurricanes, and an ACE Index of 163. No prediction for the number of major hurricanes was made.[11]
Season activity
The season's activity, was reflected with an above-average cumulative accumulated cyclone energy (ACE) rating of 125.[16] ACE is, broadly speaking, a measure of the power of the hurricane multiplied by the length of time it existed, so storms that last a long time, as well as particularly strong hurricanes, have high ACEs. ACE is only calculated for full advisories on tropical systems at or exceeding 34 knots (39 mph, 63 km/h) or tropical storm strength. Subtropical cyclones, including the early portions of Sean, are excluded from the total.[17]
Storms
|
|
||||||||||||||||||||||||||||||||||||||||||||||
|---|---|---|---|---|---|---|---|---|---|---|---|---|---|---|---|---|---|---|---|---|---|---|---|---|---|---|---|---|---|---|---|---|---|---|---|---|---|---|---|---|---|---|---|---|---|---|
|
Tropical Storm Arlene
| Tropical storm (SSHS) | |||
|---|---|---|---|
|
|
|||
| Duration | June 28 – July 1 | ||
| Intensity | 65 mph (100 km/h) (1-min), 993 mbar (hPa) | ||
The origins of Tropical Storm Arlene trace back to a tropical wave that tracked westward across the Caribbean Sea in late June.[18] It proceeded toward the west-northwest along Central America,[19] bringing heavy rainfall to the area that caused flooding and killed three people.[20][21] By June 27, the disturbance had crossed the Yucatán Peninsula and emerged into the Bay of Campeche.[22][23] Despite moderate wind shear, it organized over warm waters and was designated as Tropical Storm Arlene at midnight June 29 about 280 mi (450 km) south-southeast of Tampico, Tamaulipas.[24]
As it continued to strengthen, Arlene began to move to the west along a ridge to its north and northwest.[25] Although forecast models supported intensification to hurricane status,[26] the storm attained a peak intensity of only 65 mph (100 km/h). Arlene moved ashore near Cabo Rojo as a strong tropical storm around 0900 UTC June 30.[27] Turning west-southwestward, the storm began to weaken as it decreased in organization.[28] On July 1, Arlene was downgraded to a tropical depression just before dissipating over the Sierra Madre Mountains;[29] however, rainfall and gusty winds continued to affect portions of Mexico.[30] Arlene's impact resulted in damaging floods and mudslides throughout the country, as well as a total of 22 confirmed deaths.[31] Across the state of Hidalgo, damage from the storm reached 2.6 billion pesos ($207.4 million).[32]
Tropical Storm Bret
| Tropical storm (SSHS) | |||
|---|---|---|---|
|
|
|||
| Duration | July 17 – July 22 | ||
| Intensity | 70 mph (110 km/h) (1-min), 995 mbar (hPa) | ||
In mid July, a cold front extended westward over the North Atlantic,[33] as its westernmost component remained stationary near Florida.[34] On July 16, a low-pressure area developed to the north of the Bahamas along the weakening boundary;[35] it became better organized under abating shear conditions.[36] A closed circulation center formed, and the next day at 2100 UTC, the NHC issued the formation of Tropical Depression Two about 100 mi (160 km) northwest of Great Abaco Island.[37] It strengthened into Tropical Storm Bret just three hours after formation.[38] Moving little, Bret continued to strengthen as thunderstorms intensified around the center.[39] The storm developed an eye-like feature on July 18, indicating peak surface winds of around 65 mph (100 km/h) before it began to accelerate northeastward.[40] Although strong wind shear and dry inhibited further development,[41] Bret maintained a well-defined circulation for the next couple of days, with patches of persistent thunderstorms.[42] However, its center remained exposed, causing it weaken to a tropical depression early on July 22.[43] Despite very hostile wind shear conditions, Bret retained tropical cyclone status for several hours[44] prior to dissipating about 375 mi (605 km) north of Bermuda.[45]
Tropical Storm Cindy
| Tropical storm (SSHS) | |||
|---|---|---|---|
|
|
|||
| Duration | July 20 – July 22 | ||
| Intensity | 70 mph (110 km/h) (1-min), 994 mbar (hPa) | ||
On July 17, an area of showers and thunderstorms, associated with the same frontal system that spawned Tropical Storm Bret, consolidated around a developing area of low pressure about 345 mi (555 km) west-southwest of Bermuda. Tracking east-northeastward, the system gradually organized and became better defined. Passing south of the territory on July 19, the disturbance produced moderate rains, peaking at 1.16 in (29 mm), and gusty winds across the area. On July 20, the low developed into a tropical depression east of Bermuda. Embedded within the mid-latitude westerlies, the depression moved northeast and maintained this general direction for the remainder of its existence. Hours later, the system strengthened into Tropical Storm Cindy. Convection steadily increased over the storm and a ragged eye-like featured appeared on both visible and microwave satellite imagery. Corresponding with this, Cindy attained its peak intensity late on July 21 with winds of 70 mph (110 km/h) and a barometric pressure of 994 mbar (hPa; 29.35 inHg). Shortly thereafter, the storm moved over waters cooler than 78.8 °F (26 °C). Throughout July 22, convection diminished and Cindy transitioned into a post-tropical cyclone about 985 mi (1,585 km) southwest of Ireland. The remnants persisted for another 12 hours before degenerating into a trough over the North Atlantic, on July 23.[46]
Tropical Storm Don
| Tropical storm (SSHS) | |||
|---|---|---|---|
|
|
|||
| Duration | July 27 – July 30 | ||
| Intensity | 50 mph (85 km/h) (1-min), 997 mbar (hPa) | ||
Toward the end of July, a persistent westward moving tropical wave showed signs of organization in the Yucatan Channel. A Hurricane Hunters flight observed gale force winds and a broad circulation, which prompted the National Hurricane Center to initiate advisories on Tropical Storm Don on July 27.[47] After the storm was named, officials in Texas began making preparations for Don. The University of Texas Medical Branch in Galveston issued a level one alert for Don, and city officials began preparing for a possible evacuation.[48] The NHC later downgraded Don into a tropical depression then a remnant low after it quickly disintegrated upon making landfall and hitting the dry air over Texas as a result of the state's extreme drought, dropping much less than the forecasted rainfall at no more than 2/3 of an inch along the coast.[49]
Tropical Storm Emily
| Tropical storm (SSHS) | |||
|---|---|---|---|
|
|
|||
| Duration | August 1 – August 7 | ||
| Intensity | 50 mph (85 km/h) (1-min), 1003 mbar (hPa) | ||
A strong tropical wave tracked the open Atlantic for several days in late July. The wave remained fairly disorganized, lacking a defined circulation. By July 31, it approached the Lesser Antilles and became better defined, producing inclement weather over much of the area. Late on August 1, it finally developed a closed circulation center, prompting the National Hurricane Center to declare the formation of Tropical Storm Emily just after it had crossed the islands. On August 2, Emily continued to show signs of strengthening, even though most of the convection was off to the south and west of the circulation center. On August 4, Emily weakened into a remnant low but was expected to regenerate at least into a tropical depression. Over the next 2 days, Emily moved over the Bahamas, and up to Florida's southeastern coast, as it slowly strengthened. Later, on August 6, Emily regenerated into a weak depression, dissipating again the next day. The remnants of Emily tracked east-northeastward toward Bermuda. Soon afterwards, Emily's remnants took an eastward turn, and moved towards the open Atlantic. On August 10, convection significantly re-developed in the middle of the Atlantic Ocean, and the National Hurricane Center assessed the system as having a 10% chance of regeneration into a tropical cyclone.[50]
Tropical Storm Franklin
| Tropical storm (SSHS) | |||
|---|---|---|---|
|
|
|||
| Duration | August 12 – August 13 | ||
| Intensity | 45 mph (75 km/h) (1-min), 1004 mbar (hPa) | ||
During the early afternoon of August 10, a disorganized area of showers and thunderstorms developed off the east coast of Florida, in association with an elongated area of low pressure.[51] Tracking northeastward in response to deep southeasterly flow,[52] the disturbance slowly organized; however, by the morning of August 12, the chances of the system developing into a tropical cyclone remained low.[53] Over the following several hours, marked organization of thunderstorm activity took place around a well-defined low pressure area.[54] Subsequently, the system was classified as Tropical Depression Six that day roughly 260 mi (420 km) north of Bermuda.[55] Although well to the north of Bermuda, the system brought unsettled weather to the archipelago, with rainfall reaching 0.07 in (1.8 mm) at L.F. Wade International Airport.[56]
Maintaining a northeasterly track, the depression intensified into Tropical Storm Franklin early on August 13 following a large burst of convection over its center.[57] Later that morning, Franklin attained its peak winds of 45 mph (75 km/h) before encountering increasing wind shear and decreasing sea surface temperatures.[58] Rapid deterioration of the storm's structure took place as environmental conditions became increasingly hostile for tropical cyclones. Convection was sheared more than 100 mi (155 km) from the center of circulation and Franklin began acquiring characteristics of an extratropical cyclone.[59] Early on August 14, Franklin quickly completed its transition into an extratropical system, prompting the final advisory from the NHC.[60]
Tropical Storm Gert
| Tropical storm (SSHS) | |||
|---|---|---|---|
|
|
|||
| Duration | August 13 – August 16 | ||
| Intensity | 65 mph (100 km/h) (1-min), 1000 mbar (hPa) | ||
During the second week of August, a weak low-pressure area, located east of Bermuda, became associated with a synoptic-scale trough.[61] Dropping west-southwestward, it interacted with an upper low to produce an area of disorganized convection, and by then the NHC began to monitor the system.[62][63] By August 13, the small low had become very well-defined, with a tight wind circulation center and deep convection; it was designated as a tropical depression at 0300 UTC that day, about 360 mi (580 km) south-southeast of Bermuda.[64] As the depression re-curved west-northwestward along the weakening subtropical ridge, it intensified into Tropical Storm Gert, due to light wind shear and moist air, about 15 hours after its formation.[65] As Gert neared Bermuda, a small 7 to 9 mi (11 to 14 km) eye-like feature became apparent on radar imagery. Coinciding with this, Gert reached its peak intensity with winds of 60 mph (100 km/h).[64] Passing roughly 90 mi (150 km) east of Bermuda, Gert brought light rain and winds up to 25 mph (40 km/h) to the islands.[56] By August 16, convection associated with Gert had mostly dissipated and whether or not the system retained a closed surface low was ambiguous. As a result, Gert degenerated into a post-tropical cyclone over the open Atlantic.[66]
Tropical Storm Harvey
| Tropical storm (SSHS) | |||
|---|---|---|---|
|
|
|||
| Duration | August 19 – August 22 | ||
| Intensity | 65 mph (100 km/h) (1-min), 994 mbar (hPa) | ||
In mid-August, a westward moving tropical wave entered the Caribbean Sea. It eventually gained enough organization to be classified as Tropical Depression Eight on August 18. It was upgraded to Tropical Storm Harvey on August 19. By late August 19 the storm was intensifying rapidly and it was announced that it could become a hurricane just before landfall. However, by Saturday afternoon, August 20, Harvey made landfall, never having reached hurricane strength, resetting the Atlantic record as the first eight named storms of the season did not reach hurricane strength. Harvey was then downgraded into a depression though it briefly regained tropical storm status in the Bay of Campeche. It dissipated on August 22.[67]
Hurricane Irene
| Category 3 hurricane (SSHS) | |||
|---|---|---|---|
|
|
|||
| Duration | August 20 – August 28 | ||
| Intensity | 120 mph (195 km/h) (1-min), 942 mbar (hPa) | ||
In the evening of August 20, a large low pressure area became organized enough to be classified as Tropical Storm Irene. It passed over the Leeward Islands early on August 21. Early on August 22, Irene strengthened into a Category 1 hurricane, with winds of 75 mph (120 km/h) and a central pressure of 987 mbar (29.1 inHg), becoming the first hurricane of the season. This broke a streak of eight consecutive tropical cyclones to start the 2011 season, all of which did not strengthen beyond tropical storm force. Early on August 24, Irene became a Category 3 major hurricane, with winds of 120 mph (150 km/h). Irene went through a partial eyewall replacement cycle which weakened it slightly, but caused its wind field to greatly expand. On August 26, New York mayor Michael Bloomberg told coastal residents to 'get moving, now.'[68] The next day, Irene made landfall on Cape Lookout, North Carolina as a category 1 hurricane with 85 mph winds and unusually low pressure for a category 1 hurricane. After weakening to a tropical storm, Irene made a second U.S. landfall at Brigantine Island in New Jersey at 5:35 a.m. On August 28, still a strong tropical storm, Irene made its third U.S. landfall in the Coney Island area of Brooklyn, New York, at approximately 9:00 a.m. on August 28. Irene became a post-tropical storm over Quebec and Atlantic Canada late on August 28.[69]
Forming on August 20, Irene was the second earliest ninth Atlantic tropical cyclone on record, along with an unnamed tropical storm from the 1936 season. At least 55 people were confirmed dead across the Caribbean, 10 U.S. states and Canada in the aftermath[70] and damage from Hurricane Irene totaled $10.1 billion (2011 USD).[71]
Tropical Depression Ten
| Tropical depression (SSHS) | |||
|---|---|---|---|
|
|
|||
| Duration | August 25 – August 26 | ||
| Intensity | 35 mph (55 km/h) (1-min), 1007 mbar (hPa) | ||
In late August, a new, well-defined tropical wave moved off the west coast of Africa into the Atlantic Ocean. By August 25, the system had developed sufficient deep convection for the NHC to classify it as Tropical Depression Ten.[72] At this time, the depression attained its peak intensity with winds of 35 mph (55 km/h) and a minimum pressure of 1007 mbar (hPa). Shortly thereafter, wind shear and decreasing sea surface temperatures caused the depression to weaken, degenerating into a remnant low by the evening hours of August 26.[73]
Tropical Storm Jose
| Tropical storm (SSHS) | |||
|---|---|---|---|
|
|
|||
| Duration | August 28 – August 29 | ||
| Intensity | 45 mph (75 km/h) (1-min), 1007 mbar (hPa) | ||
On August 17, a tropical wave exited the west coast of Africa.[74] During the first few days, the tropical wave produced convection, as it slowly moved westward, and became associated with an area of low pressure. But by the next week, the wave dissipated to a weak area of low pressure – due to high wind shear – as it began to move northwestward, while fluctuating slightly in intensity. In the next few days, the tropical wave approached Bermuda; while remaining disorganized, and weakening even further. Yet very early on August 28 and during the next few hours, the tropical wave partially strengthened as conditions for development slightly improved. However, early on August 28 – during the morning hours – the tropical wave nearly dissipated due to the high wind shear once again, this time generated by Hurricane Irene, after the tropical wave passed east to the south of Bermuda.[75] But soon afterwards on August 28, the tropical wave managed to develop into Tropical Storm Jose, just to the west of Bermuda; Jose then began to move north-northeast, slowly. It lasted only 27 hours, as it dissipated on August 29.
Hurricane Katia
| Category 4 hurricane (SSHS) | |||
|---|---|---|---|
|
|
|||
| Duration | August 29 – September 10 | ||
| Intensity | 135 mph (215 km/h) (1-min), 946 mbar (hPa) | ||
The eleventh named storm of the season formed south of the Cape Verde Islands on August 29. The system became a tropical storm on August 30, at which time it was named Katia. It became the season's second hurricane early on September 1; however, its strength fluctuated until September 4 when it reached category 2 hurricane strength. On September 5 the system reached Category 3 (major hurricane status). Katia further strengthened into a Category 4 hurricane on September 5. It was downgraded to a category 1 storm by the end of the following day, and remained at that strength even as it became extra-tropical. The storm was of potential concern and was being monitored closely as it may have indirectly impacted the east coast of the United States and Canada. Warnings of severe weather were made for Northern Ireland and Scotland for the remnants of Katia.[76] Its remnants struck the UK and the Republic of Ireland on September 11 and September 12, killing one. Its remnants caused blackouts as far east as Saint Petersburg.
Unnamed Tropical Storm
| Tropical storm (SSHS) | |||
|---|---|---|---|
|
|
|||
| Duration | September 1 – September 2 | ||
| Intensity | 45 mph (75 km/h) (1-min), 1002 mbar (hPa) | ||
As part of their routine post-season analysis, the National Hurricane Center identified an Unnamed Tropical Storm that formed near 0000 UTC, on September 1, roughly 290 mi (470 km) north of Bermuda. On August 31, a disturbance formed north of Bermuda, and the NHC classified it as Invest 94L, as they tracked the storm. On September 1, the storm organized into a tropical depression, very early that morning. Despite being embedded within an environment of moderate wind shear, the depression quickly intensified into a tropical storm, although it was not assigned a name, because it was not recognized operationally. The system reached a peak intensity of 45 mph (75 km/h) early on September 2, prior to its transition into an extratropical cyclone later that day. However, the extratropical remnant of the system continued to move east-northeast, and later eastward, as it slowly weakened. On September 4, at 0000 UTC, the extratropical remnant of the unnamed tropical storm dissipated, to a weak surface trough.[77][78]
Tropical Storm Lee
| Tropical storm (SSHS) | |||
|---|---|---|---|
|
|
|||
| Duration | September 1 – September 5 | ||
| Intensity | 60 mph (95 km/h) (1-min), 986 mbar (hPa) | ||
In late August, a tropical wave producing scattered showers and thunderstorms entered the Western Caribbean.[79] Moving generally west-northwestward, the wave began to organize in the southeastern portion of the Gulf of Mexico. During the afternoon hours of September 1, the hurricane hunters went out to investigate the well-defined wave, and found a closed low-level circulation. Thus, advisories were initiated on Tropical Depression Thirteen.[80] Moving northwest, the tropical depression was upgraded to a tropical storm, given the name "Lee" on September 2.[81] Continuing to organize, Lee reached a peak intensity of 60 mph (95 km/h) early on September 3, while located just south of Louisiana. At 4 a.m. CDT September 4, Lee made landfall roughly 50 miles (80 km) to the southwest of Lafayette, Louisiana with maximum sustained winds of 45 mph (75 km/h).[82] Further weakening occurred as Lee moved across Louisiana, and the last NHC advisory on Lee was issued early on September 5, while its remnants proceeded to wreak havoc (mainly flooding) over the following two to three days northward into Pennsylvania, New York State and Canada (Quebec and Ontario).[83]
Hurricane Maria
| Category 1 hurricane (SSHS) | |||
|---|---|---|---|
|
|
|||
| Duration | September 6 – September 16 | ||
| Intensity | 80 mph (130 km/h) (1-min), 979 mbar (hPa) | ||
On September 5, a low pressure area associated with a tropical wave to the west of Africa quickly organized.[84] It was designated Tropical Depression Fourteen on the evening of September 6.[85] On the morning of September 7, it was upgraded to Tropical Storm Maria.[86] Over the tropical Atlantic, high wind shear hindered its development, and Maria nearly dissipated, before convection began to rebuild by September 9. The following day, it began to encounter more favorable conditions, and the tropical cyclone intensified into a Category 1 hurricane on September 15. On the afternoon of September 16, the storm lost tropical characteristics off the northeast coast of Newfoundland. Landfall was reported on the southern tip of the Avalon Peninsula with winds recorded at 64 mph (103 km/h). The capital city of St. John's experienced heavy rain and gale-force winds, but not as severe as anticipated.[87]
Hurricane Nate
| Category 1 hurricane (SSHS) | |||
|---|---|---|---|
|
|
|||
| Duration | September 7 – September 11 | ||
| Intensity | 75 mph (120 km/h) (1-min), 994 mbar (hPa) | ||
During the morning hours of September 6, shower and thunderstorm activity associated with a low pressure system began to gather organization in the Bay of Campeche.[88] The following day, the system gained enough organization to be classified as a tropical storm, earning the name Nate.[89] Moving in an erratic motion at a very slow pace, Nate began to strengthen. During the afternoon hours of September 8, Nate reached its peak intensity of 75 mph (120 km/h), while moving off towards the Mexican coastline. The storm was originally thought to remain a tropical storm, but post-season analysis revealed that Nate was a hurricane for twelve hours based on data from PEMEX oil rigs not available operationally.[90] Due to the storm's slow movement, Nate began to upwell cooler waters in its wake, resulting in weakening. Additionally, very dry air began getting entrained into the system. On September 11, Nate made landfall on the Mexican coastline as a weak tropical storm, with maximum sustained winds of 45 mph (75 km/h).[91] Shortly after making landfall, much of Nate's showers and thunderstorms dissipated, and thus rainfall totals were minimal.[90]
Hurricane Ophelia
| Category 4 hurricane (SSHS) | |||
|---|---|---|---|
|
|
|||
| Duration | September 20 – October 3 | ||
| Intensity | 140 mph (220 km/h) (1-min), 940 mbar (hPa) | ||
In mid-September, a well-defined tropical wave emerged off the African coastline. Moving westward, the disturbance began to gather organization, and become very well defined on September 20. Subsequently, the National Hurricane Center started issuing advisories on Tropical Storm Ophelia. Almost as soon as it became a tropical storm, vertical wind shear began impacting the system. Ophelia slowly strengthened despite the unfavorable conditions and attained winds of 65 mph (100 km/h) on September 22. The system briefly weakened to a minimal tropical storm before strengthening again. However, because of the extremely strong wind shear, Ophelia was ripped apart and dissipated into a post-tropical remnant low on September 25.
Wind shear remained strong, but not as strong as before. Thus, during the afternoon hours of September 27, Ophelia was able to develop convection near its center, and was designated a tropical depression. Ophelia gradually strengthened further into a tropical storm as it passed to the north of the Caribbean. In Dominica, heavy rains from the storm caused widespread flooding. During the afternoon hours of September 29, despite the relatively unfavorable environment, Ophelia strengthened into a Category 1 hurricane. As wind shear relaxed, early on September 30, Ophelia rapidly intensified and became a Category 2 hurricane. Later that day, Ophelia further strengthened into a Category 3 hurricane, becoming the third major hurricane of the season. The eye of Ophelia passed directly over a NOAA buoy early on October 1, which reported sustained winds of 96 mph (155 km/h) and a pressure of 952 mbar (28.11 inHg). The intensification trend continued, and Ophelia strengthened further to a Category 4 hurricane late that day east of Bermuda. Through the following day (Sunday), increasing southwesterly wind shear and cooler water temperatures combined to cause Ophelia to progressively weaken back into a Category 1 hurricane by the evening and weakened to a tropical storm during the morning hours of October 3. Several hours later, Ophelia was declared as a post-tropical cyclone soon after making landfall on the Avalon Peninsula in Newfoundland.
Hurricane Philippe
| Category 1 hurricane (SSHS) | |||
|---|---|---|---|
|
|
|||
| Duration | September 24 – October 9 | ||
| Intensity | 90 mph (150 km/h) (1-min), 976 mbar (hPa) | ||
On September 23, a well-defined tropical wave emerged off the coast of Africa, associated with plentiful shower and thunderstorm activity.[92] Moving westward and embedded within a favorable environment for development, the wave quickly became organized. During the morning hours of September 24, the National Hurricane Center designated the low as a tropical depression, while located about 290 mi (465 km) south of the southernmost Cape Verde Islands.[93] Later that day, the depression was upgraded to a tropical storm, designated "Philippe". Since that time strong shear from both upper level winds and later on from Ophelia's outflow, as well as periodic entrainment of dry air kept the cyclone both small and disorganized, with the center often exposed to the point where the low level circulation reformed under the convection that defines a tropical system at least once. An exposed cyclone can be seen as a wispy series of clouds circling a small area, rather than under the canopy of thunderstorms. Because of this hostile environment, Philippe remained near the minimum for a tropical storm briefly weakening to a tropical depression at one point. On the afternoon of October 2, an Advanced Scatterometer (ASCAT) pass confirmed that Philippe was a strong tropical storm, contrary to satellite estimates. Despite high wind shear, it remained a strong tropical storm and briefly strengthened to a hurricane when it developed an eye feature. On October 6, Philippe became a strong Category 1 hurricane. On October 8, Philippe weakened to a tropical storm, then became post-tropical hours later, on October 9.
Hurricane Rina
| Category 2 hurricane (SSHS) | |||
|---|---|---|---|
|
|
|||
| Duration | October 23 – October 28 | ||
| Intensity | 110 mph (175 km/h) (1-min), 966 mbar (hPa) | ||
In mid-October, the southern extension of a cold front moved into the western Caribbean. The front, in conjunction with east-southeasterly trade winds, produced a broad area of cyclonic circulation over the southwestern Caribbean.[94] Moving slowly towards the north and northwest, barometric pressures in the area began falling, and the disturbance was expected to move into an environment more conducive for development. Thus, the National Hurricane Center gave the disturbance a medium chance, 30%, of developing into a tropical cyclone within 48 hours.[95] Further organization occurred during the afternoon hours of October 21, as the low pressure area became more consolidated.[96] However, the following day, the disturbance became slightly less organized, depicted by a decrease in tropical cyclone formation probabilities.[97]
On October 23, a reconnaissance aircraft flew into the disturbance, finding a well-defined center of circulation. This, combined with satellite imagery, led to the formation of Tropical Depression Eighteen during the evening hours of that day; it strengthened to a tropical storm just several hours later, and earned the name "Rina".[98] Moving towards the north-northwest, Rina rapidly intensified on October 24, becoming a hurricane just 21 hours after formation. Further strengthening commenced for the remaining of the day, although Rina did not reach peak intensity until the evening hours of October 25. Shortly thereafter, the increase of wind shear and dry air led to weakening the following day, and Rina weakened to a tropical storm early on October 27. Scraping the Yucatan Peninsula, Rina brought heavy rainfall and gusty winds before turning towards the north. Early the next day, Rina weakened into a tropical depression, and during the afternoon hours, further dissipated into a remnant low.
Tropical Storm Sean
| Tropical storm (SSHS) | |||
|---|---|---|---|
|
|
|||
| Duration | November 8 – November 12 | ||
| Intensity | 65 mph (100 km/h) (1-min), 983 mbar (hPa) | ||
During the mid-afternoon of November 4, the non-tropical cyclone that would later become Tropical Storm Sean, emerged off the extreme southern coast of North Carolina.[99] On November 6, the National Hurricane Center began monitoring a non-tropical area of low pressure producing a large area of gale force winds to the southwest of Bermuda. Moving towards the south and southeast, the low pressure area began to enter higher Sea Surface Temperatures and subsequently became better organized. By the early morning hours of November 8, the low had become sufficiently organized to be declared as a subtropical storm, and then a fully tropical storm several hours later. Sean strengthened to attain a peak intensity of 65 mph (100 km/h) on November 9 and 10 before it began to enter an area of higher wind shear. Early on November 12, Sean was absorbed by a cold front, associated with a powerful extratropical cyclone centered just east of Newfoundland, while Sean was located several hundred miles to the northeast of Bermuda.[100]
Storm names
The following names were used for named storms in the North Atlantic in 2011. Names that were not used are marked in gray. This is the same list used in the 2005 season with the exception of Don, Katia, Rina, Sean, and Whitney, which replaced Dennis, Katrina, Rita, Stan, and Wilma, respectively. The names Don, Katia, Rina, and Sean were used for the first time in the Atlantic Basin.[101] Retired names, if any, will be announced by the World Meteorological Organization during the 34th session of the RA IV hurricane committee from April 11 to April 15 in 2012.[102]. The names not retired from this list will be used again in the 2017 season.
Season effects
This is a table of all of the storms that have formed in the 2011 Atlantic hurricane season. It includes their duration, names, landfall(s) –denoted by bold location names – damages, and death totals. Deaths in parentheses are additional and indirect (an example of an indirect death would be a traffic accident), but were still related to that storm. Damage and deaths include totals while the storm was extratropical, a wave, or a low, and all of the damage figures are in 2011 USD.
| Saffir–Simpson Hurricane Scale | ||||||
| TD | TS | C1 | C2 | C3 | C4 | C5 |
| Storm name |
Dates active | Storm category
at peak intensity |
Max 1-min wind mph (km/h) |
Min. press. (mbar) |
Areas affected | Damage (millions USD) |
Deaths | |||
|---|---|---|---|---|---|---|---|---|---|---|
| Arlene | June 29 – July 1 | Tropical storm | 65 (100) | 993 | Central America, Yucatan Peninsula, Florida, Mexico (Veracruz), Texas | 223.4 | 18 (4) | |||
| Bret | July 17 – July 22 | Tropical storm | 70 (110) | 995 | Florida, The Bahamas, Bermuda | None | 0 | |||
| Cindy | July 20 – July 23 | Tropical storm | 70 (110) | 994 | Bermuda | None | 0 | |||
| Don | July 27 – July 30 | Tropical storm | 50 (85) | 997 | Lesser Antilles, Greater Antilles, Yucatan Peninsula, South Texas, Northeastern Mexico | None | 0 | |||
| Emily | August 1 – August 7 | Tropical storm | 50 (85) | 1003 | Lesser Antilles, Puerto Rico, Hispaniola, Turks and Caicos Islands, Eastern Cuba, The Bahamas, South Florida | >5 | 4 (1) | |||
| Franklin | August 12 – August 13 | Tropical storm | 45 (75) | 1004 | Bermuda | None | 0 | |||
| Gert | August 14 – August 16 | Tropical storm | 65 (100) | 1000 | Bermuda | None | 0 | |||
| Harvey | August 18 – August 22 | Tropical storm | 65 (95) | 994 | Lesser Antilles, Honduras, Belize, Guatemala, Mexico (Veracruz) | Minimal | 3 | |||
| Irene | August 20 – August 29 | Category 3 hurricane | 120 (195) | 942 | Leeward Islands, Puerto Rico, Hispaniola, Turks and Caicos Islands, The Bahamas, Eastern Cuba, Southeastern United States (Outer Banks), Mid-Atlantic states (New Jersey, New York), New England, Eastern Canada | >10,100 | 49 (7) | |||
| Ten | August 25 – August 27 | Tropical depression | 35 (55) | 1007 | None | None | 0 | |||
| Jose | August 28 – August 29 | Tropical storm | 45 (75) | 1007 | Bermuda | None | 0 | |||
| Katia | August 29 – September 10 | Category 4 hurricane | 135 (215) | 946 | Leeward Islands, Bahamas, United States East Coast, Bermuda, Atlantic Canada, Ireland, United Kingdom, Scandinavia, Russia | ~157 | 4 | |||
| Unnamed | September 1 – September 3 | Tropical storm | 45 (75) | 1002 | None | None | 0 | |||
| Lee | September 1 – September 5 | Tropical storm | 60 (95) | 986 | Southern United States (Louisiana), Northeastern United States | ≥1,600 | 18 | |||
| Maria | September 6 – September 16 | Category 1 hurricane | 80 (130) | 979 | Lesser Antilles, Bermuda, Newfoundland | N/A | 0 | |||
| Nate | September 7 – September 11 | Category 1 hurricane | 75 (120) | 994 | Mexico (Veracruz) | Minimal | 4 (1) | |||
| Ophelia | September 20 – October 3 | Category 4 hurricane | 140 (220) | 940 | Leeward Islands, Bermuda, Newfoundland, Ireland, United Kingdom | N/A | 0 | |||
| Philippe | September 24 – October 9 | Category 1 hurricane | 90 (150) | 976 | None | None | 0 | |||
| Rina | October 23 – October 28 | Category 2 hurricane | 110 (175) | 966 | Honduras, Nicaragua, Yucatán Peninsula (Quintana Roo) | N/A | 0 | |||
| Sean | November 8 – November 12 | Tropical storm | 65 (100) | 983 | Bermuda | None | (1) | |||
| Season Aggregates | ||||||||||
| 20 cyclones | June 29 – November 12 | 140 (220) | 940 | >12,233.2 | 100 (14) | |||||
Accumulated Cyclone Energy (ACE)
| ACE (104kt²) (Source) — Storm: | |||||
|---|---|---|---|---|---|
| 1 | 24.8 | Katia | 11 | 1.99 | Emily |
| 2 | 20.3 | Irene | 12 | 1.85 | Gert |
| 3 | 18.4 | Ophelia | 13 | 1.71 | Lee |
| 4 | 14.8 | Philippe | 14 | 1.63 | Arlene |
| 5 | 9.07 | Rina | 15 | 1.62 | Don |
| 6 | 8.74 | Maria | 16 | 1.53 | Harvey |
| 7 | 3.83 | Nate | 17 | 0.848 | Unnamed |
| 8 | 3.33 | Sean | 18 | 0.528 | Jose |
| 9 | 2.95 | Bret | 19 | 0.283 | Franklin |
| 10 | 2.31 | Cindy | |||
| Total: 121 | |||||
The table on the right shows the ACE for each storm in the season. Broadly speaking, the ACE is a measure of the power of a hurricane multiplied by the length of time it existed, so storms that last a long time, as well as particularly strong hurricanes, have high ACEs. ACE is calculated for only full advisories on specifically tropical systems reaching or exceeding wind speeds of 34 knots (39 mph, 63 km/h), or tropical storm strength. Accordingly, tropical depressions are not included here. The ACE also does not include subtropical storms, therefore values accrued while Sean was subtropical are not calculated in its ACE. Later the NHC reexamines the data, and produces a final report on each storm, which can lead to the ACE for a storm being revised either upward or downward. Until the final reports are issued, ACEs are, therefore, provisional.
See also
- List of Atlantic hurricanes
- List of Atlantic hurricane seasons
- 2011 Pacific hurricane season
- 2011 Pacific typhoon season
- 2011 North Indian Ocean cyclone season
- Timeline of the 2011 Atlantic hurricane season
- South-West Indian Ocean cyclone seasons: 2010–11, 2011–12
- Australian region cyclone seasons: 2010–11, 2011–12
- South Pacific cyclone seasons: 2010–11, 2011–12
References
- ^ Dorst, Neal. "When is hurricane season?". Atlantic Oceanographic and Meteorological Laboratory. http://www.aoml.noaa.gov/hrd/tcfaq/G1.html. Retrieved November 25, 2010.
- ^ Kaye, Ken (2011-08-16). "Ho-hum Tropical Storm Gert makes hurricane season history". SunSentinel.com. http://www.sun-sentinel.com/news/weather/hurricane/storm-center-blog/sfl-tropical-storm-gert-breaks-hurricane-season-record-20110816,0,6053017.story?track=rss. Retrieved August 16, 2011.
- ^ a b c Philip J. Klotzbach/William M. Gray (December 8, 2010). "Extended Range Forecast of Atlantic Seasonal Hurricane Activity and Landfall Strike Probability for 2011" (PDF). Colorado State University. http://hurricane.atmos.colostate.edu/Forecasts/2010/dec2010/dec2010.pdf. Retrieved 21 April 2011.
- ^ a b Mark Saunders/Adam Lea (December 6, 2010). "Extended Range Forecast for Atlantic Hurricane Activity in 2011". Tropical Storm Risk. http://www.tropicalstormrisk.com/docs/TSRATLForecastDec2011.pdf. Retrieved 21 April 2011.
- ^ Mark Saunders/Adam Lea (April 4, 2011). "April Forecast Update for Atlantic Hurricane Activity in 2011". Tropical Storm Risk. http://www.tropicalstormrisk.com/docs/TSRATLForecastApr2011.pdf. Retrieved 21 April 2011.
- ^ a b Philip J. Klotzbach/William M. Gray (April 6, 2011). "Extended Range Forecast of Atlantic Seasonal Hurricane Activity and Landfall Strike Probability for 2011". Colorado State University. http://hurricane.atmos.colostate.edu/Forecasts/2011/april2011/apr2011.pdf. Retrieved 21 April 2011.
- ^ a b Climate Prediction Center (May 19, 2011). "NOAA hurricane outlook indicates an above-normal Atlantic season". National Oceanic and Atmospheric Administration. http://www.noaanews.noaa.gov/stories2011/20110519_atlantichurricaneoutlook.html. Retrieved 23 May 2011.
- ^ Mark Saunders/Adam Lea (May 24, 2011). "Pre-Season Forecast for Atlantic Hurricane Activity in 2011". Tropical Storm Risk. http://www.tropicalstormrisk.com/docs/TSRATLForecastPreSeason2011.pdf. Retrieved 26 May 2011.
- ^ a b "UK Met Office 2011 Atlantic tropical storm season forecast". 26 May 2011. http://www.metoffice.gov.uk/news/releases/archive/2011/2011-hurricane-forecast. Retrieved 20 June 2011.
- ^ a b Philip J. Klotzbach; William M. Gray (June 1, 2011). "Extended Range Forecast of Atlantic Seasonal Hurricane Activity and Landfall Strike Probability for 2011". Colorado State University. http://typhoon.atmos.colostate.edu/forecasts/2011/june2011/jun2011.pdf. Retrieved 1 June 2011.
- ^ a b Center for Ocean-Atmospheric Prediction Studies. "2011 FSU COAPS Atlantic Hurricane Season Forecast". Florida State University. http://coaps.fsu.edu/hurricanes/. Retrieved June 16, 2011.
- ^ Erdman, Johnathan. "WSI: Active Hurricane Season Ahead". WSI. The Weather Channel. http://www.weather.com/outlook/weather-news/news/articles/hurricane-season-outlook-july-update_2011-07-26. Retrieved 2011-07-27.
- ^ "NOAA's Atlantic hurricane season update calls for increase in named storms". National Oceanic and Atmospheric Administration. http://www.noaanews.noaa.gov/stories2011/20110804_update_atlantichurricaneoutlook.html. Retrieved 2011-08-05.
- ^ Philip J. Klotzbach and William M. Gray (2008-12-10). "Extended Range Forecast of Atlantic Seasonal Hurricane Activity and U.S. Landfall Strike Probability for 2009" (PDF). Colorado State University. Archived from the original on June 12, 2009. http://hurricane.atmos.colostate.edu/Forecasts/2008/dec2008/dec2008.pdf. Retrieved January 1, 2009.
- ^ National Hurricane Center (May 22, 2008). "NOAA Atlantic Hurricane Season Classifications". National Oceanic and Atmospheric Administration. http://www.webcitation.org/5hT3hpJ7F. Retrieved April 14, 2009.
- ^ Hurricane Research Division (March 2011). "Atlantic basin Comparison of Original and Revised HURDAT". National Oceanic and Atmospheric Administration. http://www.aoml.noaa.gov/hrd/hurdat/Comparison_of_Original_and_Revised_HURDAT_mar11.html. Retrieved 2011-07-23.
- ^ David Levinson (2008-08-20). "2005 Atlantic Ocean Tropical Cyclones". National Climatic Data Center. http://www.ncdc.noaa.gov/oa/climate/research/2005/2005-atlantic-trop-cyclones.html. Retrieved 2011-12-08.
- ^ Wallice, Patricia (2011-06-24). "Tropical Weather Discussion". National Hurricane Center. http://www.nhc.noaa.gov/archive/text/TWDAT/TWDAT.201106241032.txt. Retrieved 2011-06-25.
- ^ Garcia, Felix (2011-06-24). "Tropical Weather Discussion". National Hurricane Center. http://www.nhc.noaa.gov/archive/text/TWDAT/TWDAT.201106242356.txt. Retrieved 2011-06-25.
- ^ (Spanish) EFE (2011-06-26). "Autoridades rectifican y dicen que solo hay un muerto por lluvias en Honduras". Google Hosted News. http://www.google.com/hostednews/epa/article/ALeqM5hCsnAKfTVAzgRuC8WL76sc5RsvwQ?docId=1557133. Retrieved 2011-06-29.
- ^ (Spanish) EFE (2011-06-25). "Al menos 2 muertos y daños en puente entre El Salvador y Guatemala por lluvia". Terra Networks. http://noticias.terra.com.pe/internacional/al-menos-2-muertos-y-danos-en-puente-entre-el-salvador-y-guatemala-por-lluvia,8ef0c5dc057c0310VgnVCM20000099f154d0RCRD.html. Retrieved 2011-06-30.
- ^ Walton, Corey (2011-06-26). "Tropical Weather Discussion". National Hurricane Center. http://www.nhc.noaa.gov/archive/text/TWDAT/TWDAT.201106261130.txt. Retrieved 2011-06-28.
- ^ Walton, Corey (2011-06-27). "Tropical Weather Discussion". National Hurricane Center. http://www.nhc.noaa.gov/archive/text/TWDAT/TWDAT.201106271129.txt. Retrieved 2011-06-28.
- ^ Brown, Richard/Kimberlain, Todd (2011-06-29). "Tropical Storm Arlene Discussion Number One". National Hurricane Center. http://www.nhc.noaa.gov/text/refresh/MIATCDAT1+shtml/290014.shtml?. Retrieved 2011-06-29.
- ^ Pasch, Richard/Beven, Jack (2011-06-29). "Tropical Storm Arlene Discussion Number Four". National Hurricane Center. http://www.nhc.noaa.gov/archive/2011/al01/al012011.discus.004.shtml?. Retrieved 2011-06-29.
- ^ Pasch, Richard (2011-06-29). "Tropical Storm Arlene Discussion Number Five". National Hurricane Center. http://www.nhc.noaa.gov/archive/2011/al01/al012011.discus.005.shtml?. Retrieved 2011-06-30.
- ^ Blake, Eric/Kimberlain, Todd (2011-06-30). "Tropical Storm Arlene Discussion Number Seven". National Hurricane Center. http://www.nhc.noaa.gov/archive/2011/al01/al012011.discus.007.shtml?. Retrieved 2011-06-30.
- ^ Beven, Jack (2011-06-30). "Tropical Storm Arlene Discussion Number Nine". National Hurricane Center. http://www.nhc.noaa.gov/archive/2011/al01/al012011.discus.009.shtml?. Retrieved 2011-06-30.
- ^ Cangialosi, John/Brown, Dan (2011-06-30). "Remnants of Arlene Discussion Number Ten". National Hurricane Center. http://www.nhc.noaa.gov/archive/2011/al01/al012011.discus.010.shtml?. Retrieved 2011-06-30.
- ^ Cobb, Hugh (2011-07-02). "Tropical Weather Discussion". National Hurricane Center. http://www.nhc.noaa.gov/archive/text/TWDEP/TWDEP.201107020226.txt. Retrieved 2011-07-02.
- ^ (Spanish) EFE (2011-07-05). "La tormenta "Arlene" causó 22 muertos a su paso por México". Google Hosted News. http://www.google.com/hostednews/epa/article/ALeqM5h_QHbJv-Lf67US5j8BrPEPlTP_uQ?docId=1562449. Retrieved 2011-07-05.
- ^ (Spanish) Daniel Pérez González (August 5, 2011). "Para reparar daños por Arlene se requieren de 2 mil 360 millones de pesos del Fonden". El Visto Bueno. http://www.elvistobueno.com.mx/2011/08/para-reparar-danos-por-arlene-se-requieren-de-2-mil-360-millones-de-pesos-del-fonden/. Retrieved August 14, 2011.
- ^ Wallace, Patricia (2011-07-15). "Tropical Weather Discussion". National Hurricane Center. http://www.nhc.noaa.gov/archive/text/TWDAT/TWDAT.201107150552.txt. Retrieved 2011-07-17.
- ^ Christensen, Eric (2011-07-15). "Tropical Weather Discussion". National Hurricane Center. http://www.nhc.noaa.gov/archive/text/TWDAT/TWDAT.201107160008.txt. Retrieved 2011-07-17.
- ^ Garcia, Felix (2011-07-15). "Tropical Weather Discussion". National Hurricane Center. http://www.nhc.noaa.gov/archive/text/TWDAT/TWDAT.201107161754.txt. Retrieved 2011-07-17.
- ^ Beven, Jack (2011-07-16). "Graphical Tropical Weather Outlook". National Hurricane Center. http://www.nhc.noaa.gov/archive/gtwo/atl/201107170538/index.php?basin=atl. Retrieved 2011-07-17.
- ^ Pasch, Richard/Stewart, Stacy (2011-07-17). "Tropical Depression Two Discussion Number One". National Hurricane Center. http://www.nhc.noaa.gov/archive/2011/al02/al022011.discus.001.shtml?. Retrieved 2011-07-17.
- ^ Brown, Dan/Berg, Robbie (2011-07-18). "Tropical Storm Bret Advisory Number One A". National Hurricane Center. http://www.nhc.noaa.gov/archive/2011/al02/al022011.public_a.001.shtml?. Retrieved 2011-07-18.
- ^ Brennan, Michael (2011-07-18). "Tropical Storm Bret Advisory Number Three". National Hurricane Center. http://www.nhc.noaa.gov/archive/2011/al02/al022011.discus.003.shtml?. Retrieved 2011-07-22.
- ^ Pasch, Richard (2011-07-18). "Tropical Storm Bret Discussion Number Five". National Hurricane Center. http://www.nhc.noaa.gov/archive/2011/al02/al022011.discus.005.shtml?. Retrieved 2011-07-23.
- ^ Brennan, Michael (2011-07-19). "Tropical Storm Bret Discussion Number Seven". National Hurricane Center. http://www.nhc.noaa.gov/archive/2011/al02/al022011.discus.007.shtml?. Retrieved 2011-07-23.
- ^ Brennan, Michael (2011-07-19). "Tropical Storm Bret Discussion Number Nine". National Hurricane Center. http://www.nhc.noaa.gov/archive/2011/al02/al022011.discus.009.shtml?. Retrieved 2011-07-23.
- ^ Pasch, Richard (2011-07-22). "Tropical Depression Bret Discussion Number Eighteen". National Hurricane Center. http://www.nhc.noaa.gov/archive/2011/al02/al022011.discus.018.shtml?. Retrieved 2011-07-23.
- ^ Stewart, Stacy (2011-07-22). "Tropical Depression Bret Discussion Number Nineteen". National Hurricane Center. http://www.nhc.noaa.gov/archive/2011/al02/al022011.discus.019.shtml?. Retrieved 2011-07-23.
- ^ Beven, Jack (2011-07-22). "Post-Tropical Cyclone Bret". National Hurricane Center. http://www.nhc.noaa.gov/archive/2011/al02/al022011.discus.020.shtml?. Retrieved 2011-07-23.
- ^ Daniel P. Brown (September 16, 2011). "Tropical Cyclone Report: Tropical Storm Cindy" (PDF). National Hurricane Center. National Oceanic and Atmospheric Administration. http://www.nhc.noaa.gov/data/tcr/AL032011_Cindy.pdf. Retrieved September 20, 2011.
- ^ Beven, Jack (2011-07-27). "Tropical Storm Don Advisory Number 1". National Hurricane Center. http://www.nhc.noaa.gov/archive/2011/al04/al042011.public.001.shtml?. Retrieved 2011-07-27.
- ^ Reece, Kevin (2011-07-27). "Galveston officials keeping an eye on Don". KHOU 11. http://www.khou.com/news/Galveston-officials-keeping-an-eye-on-Don-126286208.html. Retrieved 2011-08-24.
- ^ Beven, Jack (2011-07-30). "Tropical Weather Outlook". National Hurricane Center. http://www.nhc.noaa.gov/archive/gtwo/atl/201107301745/index.php?basin=atl¤t_issuance=201107301745. Retrieved 2011-08-24.
- ^ Pasch, Richard (2011-08-09). "Tropical Weather Outlook". National Hurricane Center. http://www.nhc.noaa.gov/archive/gtwo/atl/201108090532/index.php?basin=atl¤t_issuance=201108090532. Retrieved 2011-08-09.
- ^ Michael Brennan (August 10, 2011). "Atlantic Tropical Weather Outlook". National Hurricane Center. National Oceanic and Atmospheric Administration. http://www.nhc.noaa.gov/archive/text/TWOAT/TWOAT.201108101735.txt. Retrieved August 17, 2011.
- ^ John Cangialosi and Stacy Stewart (August 12, 2011). "Tropical Depression Six Discussion One". National Hurricane Center. National Oceanic and Atmospheric Administration. http://www.nhc.noaa.gov/archive/2011/al06/al062011.discus.001.shtml?. Retrieved August 17, 2011.
- ^ Jack Beven (August 12, 2011). "Tropical Weather Outlook". National Hurricane Center. National Oceanic and Atmospheric Administration. http://www.webcitation.org/60tMwLPiA. Retrieved August 17, 2011.
- ^ Stacy Stewart (August 12, 2011). "Tropical Weather Outlook". National Hurricane Center. National Oceanic and Atmospheric Administration. http://www.webcitation.org/60tNBNMSD. Retrieved August 17, 2011.
- ^ John Cangialosi and Stacy Stewart (August 12, 2011). "Tropical Depression Six Public Advisory One". National Hurricane Center. National Oceanic and Atmospheric Administration. http://www.nhc.noaa.gov/archive/2011/al06/al062011.public.001.shtml?. Retrieved August 17, 2011.
- ^ a b "Bermuda Monthly Weather Summer (August 1–16, 2011)". Bermuda Weather Service. August 17, 2011. http://www.webcitation.org/610PuPNwS. Retrieved August 17, 2011.
- ^ Eric Blake (August 13, 2011). "Tropical Storm Franklin Discussion Three". National Hurricane Center. National Oceanic and Atmospheric Administration. http://www.nhc.noaa.gov/archive/2011/al06/al062011.discus.003.shtml?. Retrieved August 17, 2011.
- ^ Stacy Stewart (August 13, 2011). "Tropical Storm Franklin Discussion Four". National Hurricane Center. National Oceanic and Atmospheric Administration. http://www.nhc.noaa.gov/archive/2011/al06/al062011.discus.004.shtml?. Retrieved August 17, 2011.
- ^ Stacy Stewart (August 13, 2011). "Tropical Storm Franklin Discussion Five". National Hurricane Center. National Oceanic and Atmospheric Administration. http://www.nhc.noaa.gov/archive/2011/al06/al062011.discus.005.shtml?. Retrieved August 17, 2011.
- ^ Jack Beven (August 14, 2011). "Post-Tropical Cyclone Franklin Discussion Six". National Hurricane Center. National Oceanic and Atmospheric Administration. http://www.nhc.noaa.gov/archive/2011/al06/al062011.discus.006.shtml?. Retrieved August 17, 2011.
- ^ Huffman, Marshall (2011-08-10). "Tropical Weather Discussion". National Hurricane Center. http://www.nhc.noaa.gov/archive/text/TWDAT/TWDAT.201108100544.txt. Retrieved 2011-08-14.
- ^ Wallace, Patricia (2011-08-12). "Tropical Weather Discussion". National Hurricane Center. http://www.nhc.noaa.gov/archive/text/TWDAT/TWDAT.201108112345.txt. Retrieved 2011-08-14.
- ^ Stewart, Stacy (2011-08-12). "Graphical Tropical Weather Outlook". National Hurricane Center. http://www.nhc.noaa.gov/archive/gtwo/atl/201108121200/index.php?basin=atl. Retrieved 2011-08-14.
- ^ a b Berg, Robbie (26 October 2011). "Tropical Cyclone Report". National Hurricane Center. http://www.nhc.noaa.gov/data/tcr/AL072011_Gert.pdf. Retrieved 27 October 2011.
- ^ Stewart (2011-08-14). "Tropical Storm Gert Discussion Number Four". National Hurricane Center. http://www.nhc.noaa.gov/archive/2011/al07/al072011.discus.004.shtml?. Retrieved 2011-08-14.
- ^ Jack Beven (August 16, 2011). "Post-Tropical Cyclone Gert Discussion Twelve (Final)". National Hurricane Center. National Oceanic and Atmospheric Administration. http://www.nhc.noaa.gov/archive/2011/al07/al072011.discus.012.shtml?. Retrieved August 17, 2011.
- ^ Kimberlain, Wroe (2011-08-22). "Tropical Depression Harvey Discussion Fifteen". National Hurricane Center. http://www.nhc.noaa.gov/archive/2011/al08/al082011.discus.015.shtml?. Retrieved 2011-08-22.
- ^ "N.Y. mayor orders evacuations ahead of Hurricane Irene - latimes.com". Los Angeles Times. http://latimesblogs.latimes.com/nationnow/2011/08/bloomberg-orders-250000-coastal-residents-to-evacuate-by-saturday-pm.html. Retrieved August 26, 2011.
- ^ Canadian Broadcasting Corporation (2011-08-29). "Post-tropical Irene soaks Quebec, Maritimes". CBC. Associated Press. http://www.cbc.ca/news/canada/story/2011/08/29/irene-post-tropical-canada-829.html. Retrieved 2011-08-29.
- ^ "Irene leaves Vt. facing 'flooding catastrophe'". weather on msnbc. http://www.msnbc.msn.com/id/44305129/ns/weather/?gt1=43001. Retrieved 2011-08-29.
- ^ "Irene Adds to a Bad Year for Insurance Industry". New York Times. August 28, 2011. http://www.nytimes.com/2011/08/29/business/irene-damage-may-hit-7-billion-adding-to-insurer-woes.html?hp. Retrieved 2011-08-28.
- ^ Kimberlain, Todd. "Tropical Depression Ten Public Advisory #1". National Hurricane Center. http://www.nhc.noaa.gov/archive/2011/al10/al102011.public.001.shtml?. Retrieved 13 November 2011.
- ^ Pasch, Richard. "Remnants of Ten Public Advisory #8". National Hurricane Center. http://www.nhc.noaa.gov/archive/2011/al10/al102011.discus.008.shtml?. Retrieved 13 November 2011.
- ^ http://www.nhc.noaa.gov/archive/gtwo/atl/201108171754/index.php?basin=atl¤t_issuance=201108171754
- ^ http://www.nhc.noaa.gov/archive/gtwo/atl/201108281159/index.php?basin=atl¤t_issuance=201108281159
- ^ [1] Daily Record
- ^ Blake, Kimberlain, Eric, Todd (December 2, 2011). "Unnamed Tropical Storm Tropical Cyclone Report" (PDF). National Hurricane Center. http://www.nhc.noaa.gov/data/tcr/ALXX2011_Unnamed.pdf. Retrieved December 2, 2011.
- ^ http://www.nhc.noaa.gov/archive/gtwo/atl/201109021732/index.php?basin=atl¤t_issuance=201109021732
- ^ Pasch, Richard (30 August 2011). "Tropical Weather Outlook". National Hurricane Center. http://www.nhc.noaa.gov/archive/gtwo/atl/201108301746/index.php?basin=atl¤t_issuance=201108301746. Retrieved 30 August 2011.
- ^ Brown/Avila (1 September 2011). "Tropical Depression Thirteen Special Advisory #1". National Hurricane Center. http://www.nhc.noaa.gov/archive/2011/al13/al132011.public.001.shtml?. Retrieved 1 September 2011.
- ^ Stewart (2 September 2011). "Tropical Storm Lee Intermediate Advisory #4A". National Hurricane Center. http://www.nhc.noaa.gov/archive/2011/al13/al132011.public_a.004.shtml?. Retrieved 2 September 2011.
- ^ "Storm Lee makes landfall in Louisiana". The Sydney Morning Herald - smh. September 4, 2011. http://news.smh.com.au/breaking-news-world/storm-lee-makes-landfall-in-louisiana-20110904-1js1b.html. Retrieved 4 September 2011.
- ^ "Tropical Storm Lee remnants drench East Coast". CNN. September 8, 2011. http://edition.cnn.com/2011/US/09/07/weather.lee/index.html?iref=allsearch.
- ^ Stewart, Stacy. "Tropical Weather Outlook". National Hurricane Center. http://www.nhc.noaa.gov/archive/gtwo/atl/201109051136/index.php?basin=atl¤t_issuance=201109051136. Retrieved 7 September 2011.
- ^ Lixion Avila (6 September). "Tropical Depression Fourteen Discussion One". National Hurricane Center. National Oceanic and Atmospheric Administration. http://www.nhc.noaa.gov/archive/2011/al14/al142011.discus.001.shtml?. Retrieved 6 September 2011.
- ^ Lixion Avila (7 September 2011). "Tropical Storm Maria Discussion Four". National Hurricane Center. National Oceanic and Atmospheric Administration. http://www.nhc.noaa.gov/archive/2011/al14/al142011.discus.004.shtml?. Retrieved 7 September 2011.
- ^ Bailey, Sue (September 16, 2011). "Newfoundland ‘dodges bullet' as downgraded Maria veers just shy of St. John's". The Star (Toronto). http://www.thestar.com/news/canada/article/1054897--newfoundland-dodges-bullet-as-downgraded-maria-veers-just-shy-of-st-john-s.
- ^ Avila, Lixion (2011-09-06). "Tropical Weather Outlook". National Hurricane Center. http://www.nhc.noaa.gov/archive/gtwo/atl/201109061131/index.php?basin=atl¤t_issuance=201109061131. Retrieved 16 September 2011.
- ^ Blake, Zelinsky, Eric, David (2011-09-07). "Tropical Storm Nate Advisory Number 1". National Hurricane Center. http://www.nhc.noaa.gov/archive/2011/al15/al152011.public.001.shtml?. Retrieved 16 September 2011.
- ^ a b Kimberlain, Todd (2011-11-18). "Hurricane Nate Tropical Cyclone Report". National Hurricane Center. http://www.nhc.noaa.gov/data/tcr/AL152011_Nate.pdf. Retrieved 2 December 2011.
- ^ Brennan, Michael (2011-09-11). "Tropical Storm Nate Advisory Number 16A". National Hurricane Center. http://www.nhc.noaa.gov/archive/2011/al15/al152011.public_a.016.shtml?. Retrieved 16 September 2011.
- ^ Stewart, Stacy. "NHC Graphical Tropical Weather Outlook". National Hurricane Center. http://www.nhc.noaa.gov/archive/gtwo/atl/201109231142/index.php?basin=atl¤t_issuance=201109231142. Retrieved 24 September 2011.
- ^ Blake, Eric. "Tropical Depression Seventeen Public Advisory #1". National Hurricane Center. http://www.nhc.noaa.gov/text/refresh/MIATCPAT2+shtml/240858.shtml?. Retrieved 24 September 2011.
- ^ Garcia, Felix. "Tropical Weather Discussion". National Hurricane Center. http://www.nhc.noaa.gov/archive/text/TWDAT/2011/TWDAT.201110201746.txt. Retrieved 28 October 2011.
- ^ Avila, Blake, Lixion, Eric. "Graphical Tropical Weather Outlook". National Hurricane Center. http://www.nhc.noaa.gov/archive/gtwo/atl/201110211146/index.php?basin=atl¤t_issuance=201110211146. Retrieved 28 October 2011.
- ^ Kimberlain, Todd. "Graphical Tropical Weather Outlook". National Hurricane Center. http://www.nhc.noaa.gov/archive/gtwo/atl/201110212350/index.php?basin=atl¤t_issuance=201110212350. Retrieved 28 October 2011.
- ^ Avila, Lixion. "Graphical Tropical Weather Oulook". National Hurricane Center. http://www.nhc.noaa.gov/archive/gtwo/atl/201110221737/index.php?basin=atl¤t_issuance=201110221737. Retrieved 28 October 2011.
- ^ Brown, Daniel. "Tropical Depression Eighteen". National Hurricane Center. http://www.nhc.noaa.gov/archive/2011/al18/al182011.public.001.shtml?. Retrieved 28 October 2011.
- ^ http://www.nhc.noaa.gov/archive/gtwo/atl/201111041746/index.php?basin=atl¤t_issuance=201111041746
- ^ http://www.nhc.noaa.gov/archive/gtwo/atl/201111121156/index.php?basin=atl¤t_issuance=201111121156
- ^ "Retired Hurricane Names Since 1954". National Hurricane Center. http://www.nhc.noaa.gov/retirednames.shtml. Retrieved 29 November 2009.
- ^ http://www.wmo.int/pages/prog/www/tcp/HC-34.html
External links
- HPC rainfall page for 2011 Tropical Cyclones
- National Hurricane Center Website
- National Hurricane Center's Atlantic Tropical Weather Outlook
- Tropical Cyclone Formation Probability Guidance Product
|
Tropical cyclones of the 2011 Atlantic hurricane season Timeline |
||||||||||||||||||||||||||||||||||||
|
|
|
|||||||||||||||||||||||||||||||||||
|
|
||||||||||||||||||||||||||||||||||||
| Book · Category · Portal · WikiProject · Commons |
|
|
|||||